Mapping Canada's Resource Development Payments to Indigenous Governments
- Aug 25, 2025
- 5 min read
Updated: Feb 16
This article uses data from the Indigenous Resource Payment Tracker to map and analyze the flow of resource revenues from Canada’s largest resource companies to Indigenous governments and communities. We break down who is paying who, the total value of these payments, how they have changed over time, and which communities and companies stand out. The analysis also explores the types of payments being made, regional patterns, and the broader trends shaping Indigenous–industry partnerships in Canada’s resource sector.

Indigenous-Industry Partnerships in Canada
Across Canada, natural resource development is inseparable from Indigenous rights and participation. Companies must meaningfully consult with, and where appropriate, accommodate Indigenous communities whose rights and interests may be affected by a project. In many cases, these discussions lead to formal agreements — often Impact Benefit Agreements (IBAs) or similar arrangements — that outline how a resource project will deliver meaningful benefits to impacted communities. These commitments can include environmental protections, cultural and traditional safeguards, skills training, employment opportunities, community investments, and broader socio-economic measures. Agreements like these help form strategic partnerships that position Indigenous-communities as critical decision-makers and economic stakeholders in Canada's energy and resource sectors.
The Indigenous Resource Payment Tracker
The financial benefits from resource development flowing to Indigenous communities are often confidential and difficult to track, leaving a major gap in understanding the full extent of Indigenous–industry partnerships. As such, these payments represent one of the most significant and least understood economic flows in Canada.
At Indigenous Energy Monitor (IEM), we are closing this gap. Through our Indigenous Resource Payment Tracker (IRPT), we have documented over $3.3 billion in payments from Canada’s largest resource companies to Indigenous governments and communities. These include royalties, land access fees, IBA compensation, capacity funding, consultation fees, production bonuses, taxes, infrastructure improvements, and other forms of resource development-related compensation.
The IRPT offers unprecedented visibility into these financial relationships. By compiling publicly disclosed data, we can now see a detailed, cross-country picture of who is paying who, why, how much, and how these flows vary by project, commodity, and geography.
This level of transparency allows us to better understand the trends shaping Canada’s resource economy, from the companies making the largest total payments to the communities most directly benefiting from the financial considerations of resource development. In this article, we utilize the IRPT data to map the payment flows and analyze the trends in Indigenous-industry partnerships.

The National Picture
The latest IRPT data shows just how widespread and varied Indigenous–industry financial relationships have become. Our most recent data for the year 2024 shows:
197 Indigenous governments and communities received payments from 113 resource companies.
Total reported payments reached $643 million, representing a 9.4% increase from the previous year.
The largest flows were concentrated in Alberta, reflecting the location of high-value oil and gas operations, followed by Ontario, with extensive mining development activities.
The most common payment type were fees associated with resource development activities, making up 53% of reported payments.
While many Indigenous communities receive payments from a single project or operator, others have diverse portfolios, with revenue coming from multiple commodities, facilities, and agreements.
Figure 1 below maps every Indigenous community that has received reported resource development payments. Each point represents a community, with bubble size indicating the total value of payments received. Together, they reveal a complex and expanding network of economic relationships between industry and Indigenous governments, growing in both value and geographic reach.
Figure 1: Indigenous Communities Receiving Resource Development Payments

Trends Over Time
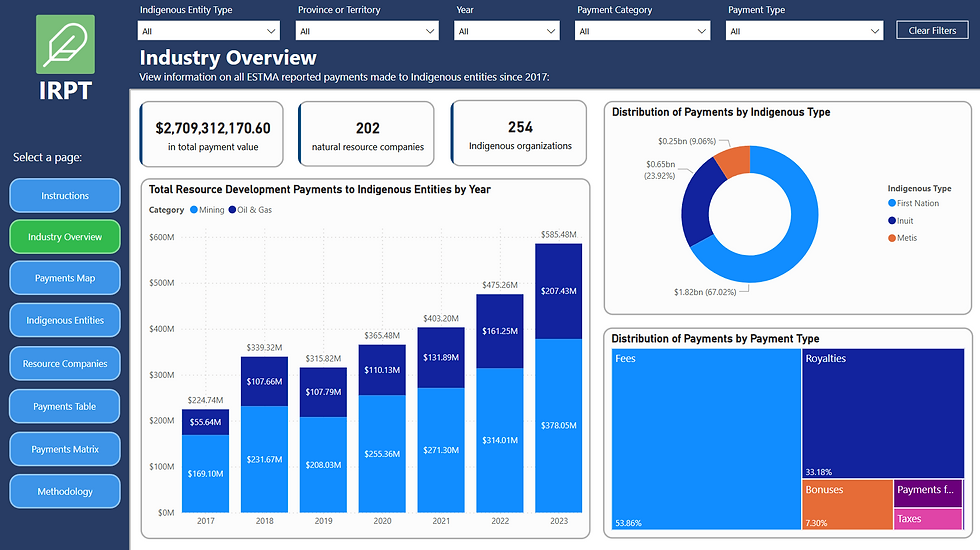
Figure 2 below shows the growth and total volume of reported payments since our dataset begins in 2017. Payments have increased at an average rate of 17% per year, driven by rising resource demand and production, new project developments, higher commodity prices, the signing of agreements, and other key factors shaping Canada’s natural resource sector.
Figure 2: Reported Resource Development Payments to Indigenous Communities

Figure 3 shows the flow of payments by type of Indigenous community. First Nations receive the largest share of resource development payments in Canada at about 67%, followed by Inuit (23%) and then Métis communities (10%). This pattern reflects both the larger number of First Nations across the country and the more limited geographic range of Inuit and Métis communities compared to First Nations.
Figure 3: Distribution of Payments by Indigenous Type

Who is Paying
The IRPT shows that the top five companies by total payment value have contributed a combined $1.1 billion since 2017 — accounting for 33% of all reported payments. Three of these five are mining companies, reflecting the sector’s significant role in revenue sharing with Indigenous communities.
Since 2017, the top contributors were:
Mining Company – $487 million paid to Indigenous communities
Mining Company – $168 million
Oil & Gas Company – $167 million
Mining Company – $158 million
Oil & Gas Company – $142 million
These companies operate some of Canada’s largest and most valuable resource projects, often under long-term agreements that deliver substantial annual royalties and other payments to Indigenous partners.
Who is Receiving
A small number of Indigenous entities account for a significant share of the total reported payments. The top five recipients have received a combined $762 million since 2017 — about 23% of all reported payments.
Since 2017, the leading payment recipients were:
Inuit Organization – $196 million received from resource companies
Inuit Organization – $171 million
Inuit Organization – $151 million
First Nation – $123 million
First Nation – $121 million

Conclusion
The data captured in the Indigenous Resource Payment Tracker shows that resource development payments are a growing and evolving feature of Canada’s natural resource economy. The scale of these payments — more than $3.3 billion since 2017 — underscores the significant economic role Indigenous governments and communities play.
Trends in the data reflect both global market forces and local realities: commodity price cycles, new project developments, and the signing of major benefit agreements all leave clear marks on annual payment totals. The diversity of recipients and the range of payment types highlight that there is no single model for Indigenous–industry partnerships and that they vary widely by geography, sector, and project structure.
Data Limitations
The Indigenous Resource Payment Tracker relies on publicly available data disclosed under the Extractive Sector Transparency Measures Act (ESTMA). This legislation requires certain resource companies to report payments made to governments related to the commercial development of oil, gas, and minerals. While this data provides valuable insight, it has notable limitations:
Reporting Threshold: Payments totaling less than $100,000 within a calendar year are not required to be disclosed.
Rounding: Reported figures are often rounded to the nearest $10,000, reducing precision.
Disclaimer: This analysis is based on publicly disclosed data and is intended for informational purposes only. It does not constitute financial, legal, or investment advice.
Unlock Transparency for Resource Development
This article outlines the importance of transparency tools like the Indigenous Resource Payment Tracker for Indigenous communities and companies engaged in resource development. By aggregating company-reported payment data pursuant to Canada's Extractive Sector Transparency Measures Act in one place, the IRPT enables users to track the monetary flows from companies to communities.
🔗Discover the IRPT Tool Here: https://www.indigenousenergymonitor.ca/irpt

Comments